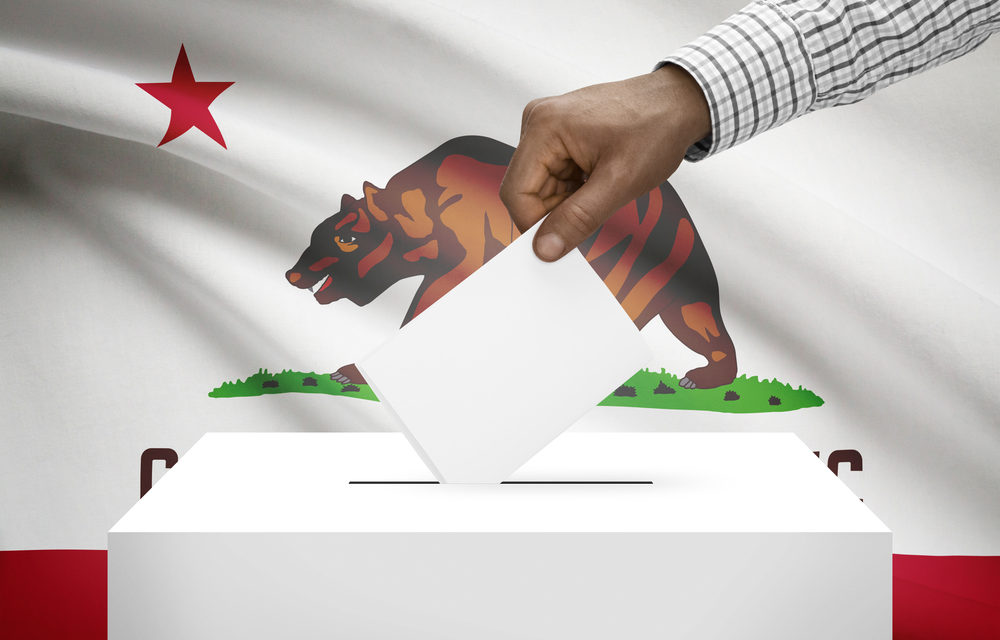
Election Day 2020: How Will Racial Minorities Shape Future Elections?
With the presidential election fast approaching and the U.S. electorate becoming increasingly more diverse, the personal-finance website WalletHub conducted an in-depth analysis that addresses one of the most important political questions of our time: How Will Racial Minorities Shape Future Elections?
This report comes on the heels of the recent analysis of the States with the Best & Worst Representation on Election Day.
In order to gauge the electoral impact of shifting demographics, WalletHub predicted which political party is likely to win the presidency from 2024 to 2060. By applying voter turnout rates for five ethnic/racial groups in the 2008 and 2016 elections to their projected population sizes from 2024 to 2060, we were able to estimate the share of votes that each party is likely to receive — and thus its likelihood of winning the White House — in each future election.
America’s demographic landscape is not only becoming increasingly more diverse, it’s also shifting national voting behavior, according to Adam McCann, financial writer for WalletHub. In a recent analysis of political-party composition, the Pew Research Center noted that “The Republican and Democratic coalitions, which bore at least some demographic similarities in past decades, have strikingly different profiles today.” This is especially true in terms of certain demographic traits, including race and ethnicity and religious affiliation. For example, the GOP has the lead among non-Hispanic white voters and religious people, while the Democratic Party is favored more by women and nonwhite voters. When it comes to racial minorities in particular, they make up four in 10 Democratic voters compared to two in 10 Republican voters.
Projected Party Winner Based on 2016 Ethnic Voting Patterns
Year: Political Party (% of Party Vote):
- 2024 Democrats (55.10%)
- 2028 Democrats (55.59%)
- 2032 Democrats (56.07%)
- 2036 Democrats (56.54%)
- 2040 Democrats (57.02%)
- 2044 Democrats (57.51%)
- 2048 Democrats (57.98%)
- 2052 Democrats (58.45%)
- 2056 Democrats (58.89%)
- 2060 Democrats (59.31%)
Projected Party Winner Based on 2008 Ethnic Voting Patterns
Year: Political Party (% of Party Vote):
- 2024 Democrats (54.69%)
- 2028 Democrats (55.11%)
- 2032 Democrats (55.52%)
- 2036 Democrats (55.93%)
- 2040 Democrats (56.35%)
- 2044 Democrats (56.78%)
- 2048 Democrats (57.19%)
- 2052 Democrats (57.60%)
- 2056 Democrats (57.99%)
- 2060 Democrats (58.36%)
To view the full report, click here.
Image Sources
- African American Voters: Shutterstock
![Healthy Desert, Healthy You [Sponsored]](https://ukenreport.com/wp-content/uploads/2026/07/2026-v2-Takaahi-Wada-Angelica-Geter-800x568-1-440x264.jpg)